What started as a minor public relations effort has resulted in an innovative new master-planning tool for the largest urban regional park district in the United States.
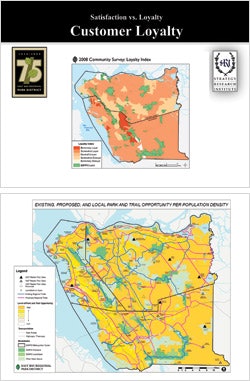 The East Bay Regional Park District is using maps of opinion data, such as customer loyalty, for insight in developing recreation facilities. (Images courtesy of the Strategy Research Institute)
What started as a minor public relations effort has resulted in an innovative new master-planning tool for the largest urban regional park district in the United States. As G. Gary Manross explains, several years ago the East Bay (Calif.) Regional Park District "had a small problem."
"There was an individual - I would call him a pseudo-scholar - who was trying to make a name for himself," says Manross, chairman and CEO of Fullerton, Calif.-based Strategy Research Institute, who has worked with the park district for more than 25 years. "He went out to three of our 64 parks, in mostly white neighborhoods, and said, 'See, there's no diversity.' He wrote a piece that got picked up by the local press that says, 'The East Bay Regional Park District doesn't care about social equity.'"
Manross says the district's leadership then asked him to compile empirical data that would challenge the claims of inequity. "One of the things that the district is so well known for historically is social equity, meaning they go out of their way to make sure that all cultures are served," Manross says. "So I went to work and got some beautiful charts and graphs, and I built a very strong case to refute this charge."
The result? "It went nowhere," Manross says. "The media loved the controversy too much, and they weren't interested in a bunch of charts and graphs and studies."
That's when Manross and the district's leadership came up with a fresh idea - to combine geographic information system (GIS) data with public opinion survey data to map public opinion throughout the two-county district, with the goal of providing easily accessible visual evidence that virtually every demographic within the district was being served equally well. "To my knowledge, nobody has ever mapped public opinion in this way," Manross says. "We have all kinds of data that shows levels of satisfaction people have with their parks. We can show where people are satisfied, geographically and culturally. We did it, and the problem went away. We showed four slides, and boom! There's your empirical evidence of social equity."
For decades, GIS has been used as a tool by parks and recreation agencies both for planning and resource management. A common application is to map existing and projected population data such as residential density, and overlay access points to certain kinds of parks. Doing so provides an immediate visual snapshot of existing levels of service and accessibility, and informs the planning of future parks and recreation facilities.
With 64 parks and more than 1,200 miles of trails spanning large urban centers such as the city of Oakland, as well as suburbs, coastline, forests, and Alameda and Contra Costa counties, the East Bay Regional Park District has its own well-developed GIS department. But the social-equity challenge was the first time the district had tried to tie in matters of public opinion with raw geographical data.
"GIS and public opinion are not concepts that typically get glued together," says Pat O'Brien, the recently retired general manager of the district. "It is quite a unique concept, and we found it to be very valuable in our master planning."
Since mapping public opinion to challenge the social inequity claims, the department has used GIS to map data including customer satisfaction levels, customer loyalty levels, barriers to facilities usage and future spending priorities. The public opinion data is collected through geographically random phone calls to high- and moderate-propensity voters (those who allocate the parks tax) as well as property owners (those who pay the parks tax). "The district is trying to be very sensitive to constituents, while making sure that collective desires are being honored," says Manross, who argues that opinion data collected through focus groups or online surveys isn't nearly as widely representative as phone call data.
Take "spending priorities" as an example of opinion mapping in action. For one report, the district created seven potential spending areas related to mostly passive recreation: walking/hiking, bicycle riding, campgrounds, beaches/swimming facilities, playgrounds, fishing, and boating/marinas. Surveys asked respondents to prioritize those recreation opportunities, and results were used to create district-wide averages. Variances from those means within specific geographic zones are easily color-coded and any number of other GIS data can be overlaid to clearly identify which recreation resources should be invested in, and in which particular geographic zones. Public data related to barriers to park usage - "How far are you willing to travel to a playground," for example - can further influence spending decisions.
It's that combination of geographic data with public opinion data that provides the department with unprecedented insight for long-term planning, says O'Brien. "It helped us underscore the sorts of things that we needed to accomplish in the park district in terms of acquisition, development and restoration," he says. "We're not just showing what public opinion is. We're marking those opinions with GIS, so we can know exactly, geographically, where things are needed."
O'Brien stresses that the introduction of public survey data gives the raw GIS maps an added practicality. He points to a grant application the department put together recently that sought funding to connect approximately 175 miles of the district's paved trails to one another and to other local and regional public transportation systems to create the largest non-motorized transportation network in the country. He says mapped public opinion data showing interest in the trail system on local levels is what helped the district receive the $10.2 million grant. Says O'Brien, "This is not just an abstract concept; $10.2 million is a definitive number."
Manross acknowledges that the data or the ways in which it's being collected isn't necessarily innovative, but the presentation of the data is forward-looking. "You don't have to read some long paper and process a bunch of charts and graphs and try to digest it all," he says. "You can take public opinion, and make it purely visual. That's the key to this whole thing."


