This article originally appeared in the October 1989 issue of AB with the headline, “Leveling the NCAA Field.”
When professional baseball introduced the designated hitter, a determination of its effect on the game was made by examining batting averages and runs scored. Similarly, when college basketball adopted the three-point rule and the shot clock, fans followed points scored to understand how the rules were working. Surprisingly, however, there has been little attempt to assess the effect of NCAA rules governing the competitiveness of a sport such as football.
NCAA rules that limit the number of grants-in-aid a university or college can provide are obviously directed toward preventing one team from stockpiling blue-chip recruits. Other rules, such as restrictions on the number of coaches or limits on the number of days of practice, can also be interpreted as measures to “level the playing field.” Unlike rules covering point values or fouls, these rules governing administrative procedures and operations are designed to foster on-field athletic competition between member schools.
To assess the effect of these and similar association rules, a test was developed to measure the competitiveness of football. The test was first applied to professional football and then to big-time college football. These results indicated a significant difference in the competitiveness of professional and amateur football.
For a sport to be characterized as competitive, we would expect to see variation in the “top” teams over time. That is, a truly competitive sport should be characterized by many teams of equal talent sharing the national spotlight. Conversely, a less competitive game would feature a small number of superior teams that form the game’s elite.
To test this hypothesis, an examination was made of professional football’s end of season standings for the 1966 to 1988 seasons to identify the years’ best teams. A point system was developed that awarded points according to the team’s record (i.e., team with the best record received the most points, the second team received fewer points and so forth, with the worst team receiving no points). The 22 years were then divided into three time periods to compare changes through the years. Points were summed for each team during the periods and teams were ranked by points, with more points reflecting a stronger performance.
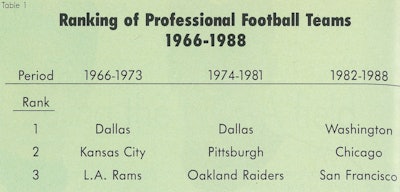
Table I presents the results of the top three professional teams in each period. (With 28 professional teams, the top three are approximately the top 10 percent.)

The most important point from table 1 is that eight different teams occupy the nine possible positions. If talent and luck were distributed evenly among the teams, each would have the same chance of becoming a champion. Were this true, as many as nine teams could be listed in table 1. Listing eight teams in table 1 indicates a high turnover at the top—solid evidence that professional football is very competitive.
Two primary reasons account for this. First is the NFL’s admitted move toward parity. The league recognizes the benefits—increased attendance and television viewership—from preventing dominance, and has structured schedules and league rules to create equality. The second reason is that talent is explicitly allocated through its player draft, allowing the worst teams to obtain top talent. Various legal challenges have been levied against the draft, but in terms of fostering competitiveness, its effect appears positive.
A similar analysis was performed using college football teams and their final season rankings in the Top 20 Associated Press Poll. Table 2 presents the top 10 teams for each period. (With approximately 100 big-time football programs, 10 teams represent 10 percent of the sport.)

Notice that only 16 different teams occupy the 30 possible positions in table 2. If the appearance of only 10 teams would indicate a completely non-competitive sport and the appearance of 30 different teams a highly competitive sport, 16 teams suggests that between 1966 and 1988, major intercollegiate football was slightly uncompetitive.
Another method of measuring competitiveness is to consider how often the same teams appear in table 2, with the idea being that the greater the number of repeating teams, the less competitive the sport, and vice versa. Of the top 10 teams in period 1, it appears that rules enacted in the late ‘60s and early ‘70s had little effect on competitiveness during this time.
By period 3, however, five previously unranked teams appeared in the top 10. This dramatic change in the standings indicates that rules put in place since the mid- ‘70s have had a much greater effect on the competitiveness of football. While the overall assessment of competitiveness between 1966 and 1988 is low, this trend suggests that big-time college football is becoming a more competitive game.
This may be encouraging, but consider why this result—low, but improving competitiveness—has occurred. First, we can eliminate chance. The random probability of so many teams repeatedly appearing in the sport’s top positions is approximately 1 million to one. A better explanation of why top football teams continue to retain their prominence comes from understanding how talent is allocated through the recruiting process.
For a football program to succeed, it needs to attract a sizeable number of skilled high school and junior college athletes each year. As we know, it is not unusual for the best of these athletes to be recruited by scores of schools. With so many schools to choose from, why do the best athletes attend the same handful of schools?
If the athlete wants to play for a winner, appear on television and pursue a professional football career, he logically selects the school that is presently nationally prominent. Signing “blue-chip” athletes helps continue a tradition where success brings national exposure, allowing the school to attract the best recruits who, in turn, keep the program on the winning track. Once started, this cycle is difficult to break. As two recruits told a rival Big 10 coach when announcing their decision to attend Ohio State, “It has nothing to do with your program, but we want Rose Bowl rings.”
Without limits on the number of recruits who could be signed, that best teams could consistently obtain the talent to dominate the sport. This is what appears to have happened across the first two periods in table 2.
With the adoption of limits on the number of grants-in-aid in the mid- ‘70s (when total grants-in-aid were limited to 95), talent has necessarily been distributed between more teams. Whereas a team once might have awarded upward of 50 grants-in-aid per year, that number was limited to 30 in the mid- ‘70s and was further limited to 25 beginning this year, leaving the remainder to be signed by rival teams. As more teams have access to better talent, we expect the sport to be more competitive. Again, this is what appears to have happened between period 2 and 3 in table 2, as five new teams made their first appearance in the top 10.
At first glance, the NCAA appears to be fostering a more competitive game through the institution of the new rules. But NCAA efforts pale when compared to the success of the NFL, which has established a very competitive game. This observation naturally raises a question about what actions the NCAA can pursue to further enhance the competitive of intercollegiate football. I believe the NCAA has two options.
Option1: Adopt more rules governing football. The apparent success of rules instituted since the mid- ‘70s indicates that additional limits could be imposed to reduce the advantages teams have developed over time. New rules must be simple to interpret and administer or they may further burden an already cumbersome and bureaucratic process.
One such rule could be a reduction in the number of grants-in-aid offered by schools that finish in the top 10 and a corresponding increase in the number provided by the poorest performers. For example, the top 10 schools would only be allowed to sign 20; the year’s 10 worst teams would be allowed to sign 30, keeping the total number of grants-in-aid unchanged. This rule would enhance competitiveness by reducing the advantages accruing to the top teams and assisting efforts by the worst teams to improve.
Option 2: Reduce rules governing football. Fewer, but broader, rules could be established that allow teams greater discretion while still adhering to general NCAA policies. For example, if a grant-in-aid is valued at $10,000 per year, allowing 25 signings per year is the same as allowing a university to spend $250,000. Instead of stipulating a 25-grant-in-aid limit, the NCAA could institute a $250,000 limit and provide universities the flexibility to determine how it will be spent. Under this approach, a school that seeks national recognition could decide to sign only 20 athletes and use the remaining money for athletic stipends. Through the use of insight and imagination, little-known schools could better challenge the established schools at recruiting time.
Efforts to enhance football competitiveness focus on allocating talent evenly among the teams. While the NFL has been quite successful using a player draft, recent NCAA success is related to rules limiting the numbers of recruits. Additional NCAA rules can be designed to make college football more competitive. Whether these new rules reduce or increase the flexibility available to member institutions is now the key issue.
About the Author:
Paul R. Lawrence, Ph.D., is a sports consultant with Price Waterhouse in Washington, D.C., and author of Unsportsmanlike Conduct: The NCAA and the Business of College Football.


