Much has changed in America since March 2017, when for the first time AB published a purchasing survey as part of its annual Buyers Guide. However, results of a second-year survey indicate the athletic, fitness and recreation industries remain on a fairly steady budgetary course.
Earlier this year, AB reached out to high schools, colleges, health clubs, YMCAs, military installations and other organizations and received statistical insights from 288 total respondents. It's a group that closely mirrors the demographic makeup of the 2017 sample, with nearly 50 percent of those surveyed holding jobs in athletics and slightly more than 30 percent representing recreation. Fitness respondents again comprised roughly 10 percent of the sample. That said, whereas 2017 saw high school representatives enjoy a plurality (32 percent) among respondents, college and university employees comprised a leading 34 percent of the 2018 field.
Here are some key findings:
While nearly one in 10 respondents from both surveys reported budget decreases from the previous year, fewer 2018 respondents saw an increase (27 percent as opposed to 2017's 31 percent).
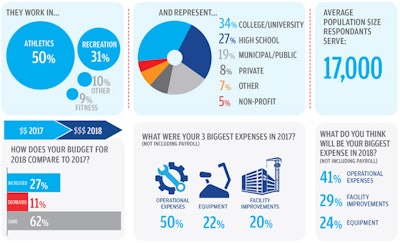
Respondents to both surveys reported that their organization spent nearly the same amount on equipment and on facility improvements during the previous year, yet both surveys indicated that their respective respondents anticipated facility improvements to consume more of their budget than equipment in the year at hand. In fact, the 2018 survey revealed an anticipated rise in budget allocation for both expense categories — with 29 percent of respondents expecting facility improvements to be their largest non-payroll budget expense (up from 23 percent in 2017), and 24 percent of respondents identifying equipment (up from 17 percent).
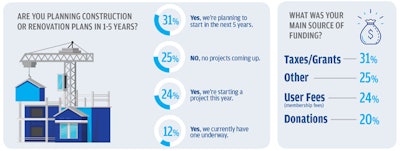
Fully two-thirds of 2018 respondents report that their organization is either in the midst of a major construction or renovation project or about to embark on one — a direct match of last year's results. Nine respondents this year report projects exceeding $50 million, while 10 times as many (a full 60 percent of the field) are engaged in projects costing less than $5 million.
Taxes and grants still lead the way in terms of funding sources, though the share of responses dropped from 35 to 31 percent since last year. Meanwhile, reliance on philanthropy appears to be on the rise. In 2017, 12 percent of survey respondents listed donations as their main source of funding. This year, that figure topped 20 percent.

Factors driving purchasing decisions remained virtually unchanged from one survey to the next, with the economy, equipment innovation, industry-wide programming trends, sustainability and political climate occupying the same descending order. The product type identified by most respondents (25 out of 193 who answered this question) as their most successful purchase? Cardio, weight, functional strength or rehab equipment. Other responses ran the gamut — from a gym divider curtain to LED field lighting, from wall paint to buses.
Finally, product reputation still trumps price among 2018 purchasers (36 percent to 29 percent), though the gap was even wider a year ago (37-22).
Athletic Business would like to thank those who took time to respond to this year's purchasing survey. The information becomes more illuminating and reliable with each response. AB's editors expect that with continued and expanded reader input, this annual exercise can provide a useful snapshot of trends in the athletics, fitness and recreation industries at large.
This article originally appeared in the March 2018 issue of Athletic Business with the title "The purchasing survey 2018." Athletic Business is a free magazine for professionals in the athletic, fitness and recreation industry. Click here to subscribe.


