





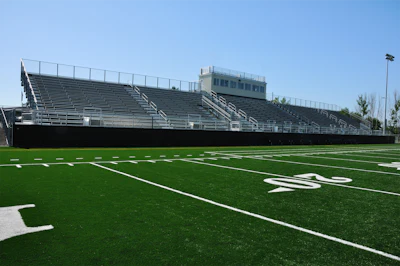
You know everything about running a tight athletics program — schedules, budgets, compliance, recruiting. But when the AV integrator starts talking about “SPL thresholds” and “reverberation times,” suddenly you feel like you wandered into the wrong meeting. Don’t worry. Here’s what those terms actually mean, what the spec sheet isn’t telling you — and why all of it matters for your facility.
Loud isn’t the same as good
Every athletics director has been in a gym where the PA was cranked to full volume and nobody could understand a word. Congratulations — you’ve experienced the cruel paradox of bad audio. More power doesn’t equal more clarity. It usually means more chaos, bouncing off every hard surface until your announcer sounds like he’s gargling gravel inside a submarine.
The technical term for that chaos is reverberation — the persistence of sound after the source stops. It’s the echo that turns “Now batting, number seven, Marcus Johnson!” into “…ow…atting…umber…eeeeven… Maaarcuuus…” Reverberation is measured in RT60 — how long it takes sound to decay by 60 decibels. A good gymnasium might have an RT60 under one second. An untreated natatorium? You might as well be making announcements from inside a cathedral-sized bathtub.
SPL: The most inflated number in audio
When a manufacturer claims a speaker delivers “118 dB SPL” (Sound Pressure Level), that number sounds impressive. It might also be fiction. SPL ratings are among the most manipulated figures in pro audio. Some manufacturers measure peak SPL — the absolute maximum a speaker produces for a fraction of a second before distorting — rather than continuous SPL, which reflects real-world performance. Others measure at one meter from the cabinet in a perfect test environment. Try getting that result from 60 feet up in your upper deck.
Always ask: Is this continuous or peak SPL, and at what distance? If a vendor can’t answer clearly, that’s your first red flag.
Red flags: What honest specs look like
Reputable manufacturers back their numbers with full performance graphs — polar plots, frequency response curves and directivity data showing exactly how a speaker behaves across its operating range. These are generated through rigorous measurement and can’t easily be fabricated.
If a competitor’s spec sheet is nothing but a table of impressive numbers with no supporting graphs, ask yourself why. The answer is usually that the graphs would tell a less flattering story. Missing performance data and inflated SPL claims go hand in hand. Treat a manufacturer that won’t show you a polar plot the way you’d treat a recruit whose highlight tape somehow never includes any defense.
Frequency response: Graphs don't lie
Sound frequency is measured in Hertz (Hz). Low frequencies — bass, crowd rumble — live in the 20– 200 Hz range. The high frequencies that carry speech clarity occupy 2,000–8,000 Hz. A speaker that’s all boom and no crispness will fill your arena with noise while your PA announcer’s actual words dissolve.
Ask for the frequency response graph — a line that should be reasonably flat from roughly 80 Hz to 12,000 Hz. Wild peaks and valleys mean certain sounds are over-amplified while others vanish. An honest spec sheet shows you that graph. A dishonest one gives you a single “frequency range” number that tells you almost nothing.
Horn size: Where physics cannot be faked
Two speakers can both claim a “60° x 60° coverage pattern” and perform completely differently. Here’s why: horn size matters, and this is one area where physics is non-negotiable.
A speaker with a small horn will lose directional control as frequencies drop, causing the coverage pattern to balloon outward at lower frequencies and flood your room with unwanted reflections. A speaker with a properly sized large horn maintains controlled dispersion across a much wider frequency range — meaning more consistent coverage, less reverberation and clearer speech.
This isn’t a marketing claim. The wavelength of lower-frequency sound is simply too long for a small horn to control. No clever engineering or glossy brochure can change that. When comparing products, ask for polar plots at multiple frequencies — 500 Hz, 1 kHz, 2 kHz and 4 kHz. A speaker showing tight, consistent coverage across that range is telling you the truth. One that only provides a plot at 1 kHz — the most flattering measurement point — is hiding something.
Driver size and cabinet volume are similarly impossible to misrepresent, because you can verify them with a tape measure. A speaker claiming enormous output from an unusually small enclosure should raise questions. You can’t fake physics.
Room design, coverage: One size fits nobody
Directional coverage keeps sound aimed at your audience and away from reverberant walls, ceilings and floors. In large arenas, line array systems — those vertical speaker columns above NBA courts — project sound over long distances with precision. In a multipurpose gym, distributed ceiling speakers with tighter coverage often work better. An outdoor stadium brings entirely different challenges: no reverb problem, but distance, wind and weather instead. Any integrator telling you their standard package works everywhere is either uninformed or incurious.
DSP: The brain that ties it together
Every modern system runs through a DSP (Digital Signal Processor) — the air traffic controller of your audio. It manages delays between speaker zones, equalization for your room’s acoustic quirks, and routing to the right areas at the right levels. Without proper configuration, even the best speakers underperform.
Ask any bidder: How will the DSP be tuned after installation? The answer should involve acoustic measurement software and a formal calibration process. “We’ll set it up and it should be fine” is not an answer — it’s a future service call.
The bottom line
You don’t need to become an audio engineer. You need to be a smart buyer. Demand full performance graphs, not just spec tables. Ask how SPL was measured. Look at the horn — physically — and compare sizes between proposals. Request polar plots at multiple frequencies. If a vendor can’t or won’t comply that tells you everything.
Good audio is invisible — nobody notices it because it just works. Bad audio is impossible to ignore. The specs exist to protect you. Learn to read them, demand the honest ones, and your facility will sound exactly the way it should.
SOUND CHECK: A FIELD GUIDE TO AUDIO JARGON
Because you shouldn’t need a physics degree to buy an audio system.
- SPL (Sound Pressure Level) — The measured level of sound at a specific point in space, expressed in decibels. It tells you how much sound is reaching a listener or measurement position, which is why location matters.
- Loudness — How strong or soft that sound seems to a listener. Loudness is related to SPL, but it is not the same thing. SPL is a physical measurement, while loudness is the human perception of that sound.
- Reverberation — What happens when sound bounces around a room and refuses to leave. The longer it lingers, the worse it gets.
- RT60 — The time it takes reverberant sound to die down by 60 decibels after the source stops. A low RT60 means a “dry,” intelligible room. A high RT60 means your announcer sounds like they’re calling the game from inside a parking garage.
- Frequency — Describes the pitch of a sound, measured in Hertz (Hz). Low frequencies are the bass rumble you feel in your chest. Much of speech intelligibility, especially consonant clarity, depends on mid and high frequencies — the sounds that make the difference between “Marcus Johnson” and “…arcus…onson.”
- Frequency Response — How evenly a speaker reproduces sound across the full range of frequencies. A flat, consistent response is good. A jagged one means some sounds boom while others disappear — like a system that handles “GOOOAL” beautifully but swallows the referee’s whistle entirely.
- Coverage Pattern — The angle at which a speaker projects sound, measured in degrees. Tighter patterns aim sound precisely at the audience. Wider patterns are more generous — sometimes too generous, spraying sound onto walls and ceilings and feeding the reverberation monster.
- Horn — The flared mouth of a speaker that shapes and controls where sound goes. Larger horns can maintain pattern control to lower frequencies, depending on the design. Smaller horns look sleek and are great at controlling sound in brochures.
- DSP (Digital Signal Processor) — The behind-the-scenes brain of a sound system. It handles delays, equalization and routing so everything arrives at your ears at the right time, at the right level. A system without proper DSP tuning is like a great roster with no coach.
- Polar Plot — A graph showing a speaker’s coverage pattern at different frequencies. If a manufacturer won’t show you one, ask why. The answer will be informative.

www.biamp.com | 800-826-1457 | [email protected]