Thirty cities from around the USA house NFL teams, but which one really offers fans the best experience and is the ultimate destination to watch the game?
A new report from Action Network has revealed which US city, home to an NFL side, offers the best overall experience for game day.
To discover which American city is best for NFL game day, a ‘Cost Index’, ‘Stadium Index’ and ‘Team Index’ were created. Different factors such as: prices for food, drinks, parking, tickets as well as stadium capacities and social media sentiment was taken into account and weighted according to importance.
The Best US Cities for Game Day
Considering game-day costs, quality of stadium and positive social sentiment, Atlanta is crowned as the best US city for game day. Observing the data, Atlanta comes out as the 2nd most reasonable game day after Cincinnati, and places 4th on the ‘Stadium Index’, resulting in them leading the way overall with a score of 12.72 out of 20.
Los Angeles sits in 28th place, receiving a score of just 5.89 out of 20. Looking into the data, it's clear that high costs lead to the demise for L.A. as tickets, parking, food and drink are some of the most expensive in the country. The only factor saving LA from 30th place is thanks to both Rams and Chargers calling it home.
The full list and rankings of the 30 cities can be seen below:
|
Rank |
City |
Home Stadium |
NFL Team |
Total Index |
|
1 |
Atlanta |
Mercedes-Benz Stadium |
Atlanta Falcons |
12.72 |
|
2 |
New York |
MetLife Stadium |
New York Giants and New York Jets |
11.80 |
|
3 |
Nashville |
Nissan Stadium |
Tennessee Titans |
11.29 |
|
4 |
Cincinnati |
Paul Brown Stadium |
Cincinnati Bengals |
11.24 |
|
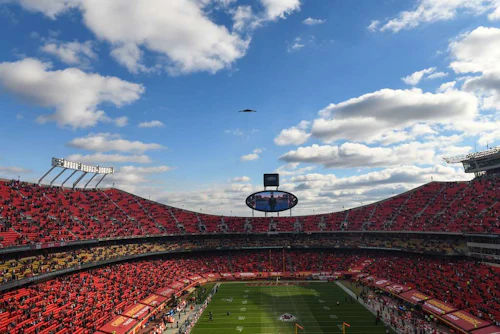
5 |
Kansas City |
Arrowhead Stadium |
Kansas City Chiefs |
11.07 |
|
6 |
Phoenix |
State Farm Stadium |
Arizona Cardinals |
10.94 |
|
7 |
Charlotte |
Bank of America Stadium |
Carolina Panthers |
10.77 |
|
8 |
Green Bay |
Lambeau Field |
Green Bay Packers |
10.75 |
|
9 |
Miami |
Hard Rock Stadium |
Miami Dolphins |
10.74 |
|
10 |
Cleveland |
FirstEnergy Stadium |
Cleveland Browns |
10.61 |
|
11 |
Indianapolis |
Lucas Oil Stadium |
Indianapolis Colts |
10.11 |
|
12 |
Tampa |
Raymond James Stadium |
Tampa Bay Buccaneers |
10.00 |
|
13 |
Baltimore |
M&T Bank Stadium |
Baltimore Ravens |
9.88 |
|
14 |
Buffalo |
Highmark Stadium |
Buffalo Bills |
9.83 |
|
15 |
Houston |
NRG Stadium |
Houston Texans |
9.82 |
|
16 |
Denver |
Empower Field at Mile High |
Denver Broncos |
9.69 |
|
17 |
Jacksonville |
TIAA Bank Field |
Jacksonville Jaguars |
9.60 |
|
18 |
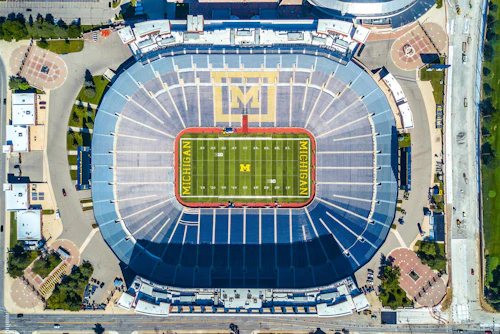
Detroit |
Ford Field |
Detroit Lions |
9.38 |
|
19 |
Dallas |
AT&T Stadium |
Dallas Cowboys |
9.35 |
|
20 |
Las Vegas |
Allegiant Stadium |
Las Vegas Raiders |
9.28 |
|
21 |
Washington DC |
FedExField |
Washington Football Team |
8.72 |
|
22 |
New Orleans |
Mercedes-Benz Superdome |
New Orleans Saints |
8.71 |
|
23 |
Pittsburgh |
Heinz Field |
Pittsburgh Steelers |
8.22 |
|
24 |
Seattle |
Lumen Field |
Seattle Seahawks |
7.85 |
|
25 |
Minneapolis |
U.S. Bank Stadium |
Minnesota Vikings |
7.54 |
|
26 |
San Francisco |
Levi's Stadium |
San Francisco 49ers |
6.83 |
|
27 |
Boston |
Gillette Stadium |
New England Patriots |
6.57 |
|
28 |
Los Angeles |
SoFi Stadium |
Los Angeles Chargers and Los Angeles Rams |
6.16 |
|
29 |
Philadelphia |
Lincoln Financial Field |
Philadelphia Eagles |
6.16 |
|
30 |
Chicago |
Soldier Field |
Chicago Bears |
5.89 |
For further information, please visit the site here: https://www.actionnetwork.com/nfl/best-us-city-for-gameday
[ENDS]
Methodology
To create the game-day index, firstly, the data for the cost of watching a game was gathered. This included prices for beer, soft drinks, hot dogs, parking, and tickets. These were all normalized and summed to give a total “Cost Index”. As some costs are more important than others, it was necessary to weight them. All of the food indexes were given a weight of one. The parking was given a weight of three. The tickets were given a weight of five. Giving a total maximum score of 11.
After this data was gathered about the stadiums where people watch the game. Information was collected about the type of roof and the stadium capacity. Alongside this, Linkfluence was used to determine the number of positive posts on social media about the stadium from 01/07/2020 - 30/06/2021, to see whether or not visitors liked it.
This data was then normalized and summed to give a total “Stadium Index”. Like the prices, the factors here were also weighted according to importance. The roof type had a weight of one, whereas the capacity and social media sentiment each had a weight of three. Giving a total maximum score of 7.
The final data table was then created to summarize this data. An extra index looking at the number of NFL teams in the city was also added to this table. As more teams allow for a better opportunity to watch a good NFL game.
Following on from this the three indexes were then summed and ranked, to provide the final data set. The final score was out of 20.