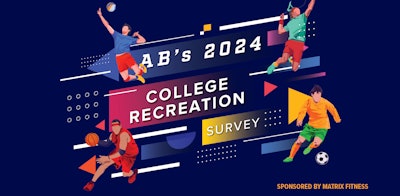
It’s been two years since AB last surveyed collegiate recreation professionals to take the industry’s pulse. That 2022 survey started to signal a recovery from the wildly volatile pandemic years, and the 2024 iteration appears to follow a similar general trajectory. Simply put, the heartbeat of the industry is returning to normal.
Before we break down this year’s numbers, let’s learn about the 2024 field of respondents. Our sample is made up largely of institutions with 5,000 or more active members (60%). Most (60%) employ 25 or fewer permanent staff members, while another 24% have permanent staffs numbering between 26 and 51. Nearly as many (7%) employ more than 200 as those with staffs ranging from 101 to 200 (9%).
Student staff sizes among survey respondents descend steadily from a plurality reporting more than 200 students (41%) down to 101 to 200 (27%), 51 to 100 (17%), 26 to 50 (12%) and 1 to 25 (3%).
A full 57% of this year’s respondents run indoor recreation facilities totaling between 100,000 and 500,000 square feet, and an additional 8% oversee even more square footage than that. Singular “flagship” rec centers measure between 100,001 and 200,000 square feet for a third of this year’s sample, with those in the 50,001-to-100,000 range close behind at 30%. The sample-wide range sees 19 of our respondents claiming flagship facilities that top 200,000 square feet, while one checks in under 5,000.
Outdoor facility sizes skew toward the small end of the spectrum, with 56% of our sample reporting 100 acres or less. From there, sample percentages dwindle as suggested acreage in our survey increases — that is, until those reporting more than 10,000 acres (8%) outnumber those reporting between 5,000 and 10,000 (5%).
More respondents rely on student fees than university funds to cover operational costs, and a clear majority (54%) operate facilities closed to the general public.
With all that in mind, what did we learn from the 2024 field?
Collegiate recreation professionals have a lot on their minds, as evidenced by our survey results, but engaging more students was the top priority for the lion’s share of our sample (44%). That clearly outpaced increasing revenue (20%), buying new equipment (17%), renovating facilities (12%), implementing cost-saving measures (5%) and implementing sustainability measures (2%). The good news is that the same field that prioritizes student engagement above all else reports that engagement was up in 2023 for 73% of respondents, down for only 25% and flat for 2%.
When asked if there was one type of cardio, strength or functional fitness equipment that they would desire for their fitness centers but don’t currently offer, a surprising 61% of respondents pointed to sleds on our list of 23 items, making sleds twice as sought-after as balance training (30%), more than three times the response rate for battle ropes (18%), and roughly four times ahead of slam balls, squat/power racks and suspension training (16% each).
In terms of group exercise programming popularity, yoga is currently offered by 96% of respondents, a return to 2021 levels following a dip to 71% in 2022. Hot yoga, meanwhile, lands on the opposite end of the latest survey spectrum, with only 8% of our sample offering it. Indoor cycling (88%), functional fitness or high-intensity interval training (77%), aerobics/cardio (75%), strength training (75%) and Zumba (72%) all enjoy a healthy share of our surveyed universe. The field is evenly split in terms of which class size pulls the most consistent attendance, with 51% saying “large,” and 49% saying “small” (fewer than 12 students). That’s a slight shift from 2022, when a full two-thirds of respondents reported their members preferred small-class settings.
It’s worth noting, too, that in this era of holistic offerings slightly more than half (53%) of survey respondents offer group meditation/mindfulness classes. Moreover, 77% of respondents report emphasizing the mental health benefits of exercise in their marketing, and another 15% are in the process of doing so.
Not surprisingly, overall marketing channels skew distinctly digital, with Instagram emerging as the favored medium for communicating with members (84%), edging the rec department website by a single percentage point, while other social media platforms — Facebook (46%), X (29%) and TikTok (27%) — don’t fare nearly as well. Meanwhile, email is considered the best mode of audience engagement by 67% of respondents.


Thanks to all the professionals who took time out of their busy schedules to contribute to our data-collection efforts this year. We hope to survey the collegiate recreation industry again soon.


