
Professionals in the athletics, fitness and recreation industries are constantly challenged to improve their facilities, whether those facilities accommodate hundreds of users or tens of thousands. Improvement may take the form of new walls and roofs, or upgraded treadmills and turf. It all costs money, and making the right choice is critical. For the fourth straight year, AB asked hundreds of industry pros with purchasing power for their insights into current wish lists and war chests. Here's what we learned:

The core markets represented by this year's respondents shake out in familiar fashion to years past: 36 percent come from collegiate athletics, 23 percent from high school athletics and 14 percent from municipal agencies. The balance encompasses an eclectic mix of military bases, gyms, architecture and engineering firms, hospitals, professional sports teams, and other public and private entities.
The average size of constituencies was 15,640, ranging from 200 to 50,000. In fact, 47 individual respondents reported serving program populations between 49,000 and 50,000.
In terms of how much money respondents anticipate spending on their populations, 64 percent said their 2020 budget remains largely unchanged compared to 2019. Only 23 percent said their budget has increased — a low watermark in the survey's four-year history and a full eight points below 2017's high of 31 percent. Among those who reported budget increases for the current year, 41 percent represent athletic departments, 30 percent represent recreation departments and 20 represent fitness facilities.
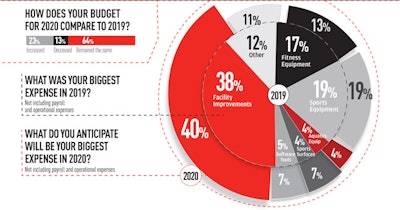
Of those reporting budget decreases, 55 percent represent colleges and universities, and another 21 percent high schools. No other category hit double-digit representation.
Survey participants cited four primary funding sources for their programs, and in near equal numbers. These include taxes or grants (22 percent of respondents), donations/gifts/endowments (21 percent), membership/user fees (20 percent) and college/university budgets (19 percent).
More than a third (38 percent) of respondents spent the bulk of their money last year on facility improvements — once payroll and operational expenses are removed from consideration — followed by sports equipment (20 percent) and fitness equipment (17 percent). Spending priorities for 2020 will be nearly identical. Facility improvements are tops for 39 percent of our sample, followed by sports equipment (19 percent) and fitness equipment (12 percent). Forty percent of the sample indicated that facility improvements are "very important" to them, 17 percentage points higher than equipment replacement. That said, equipment replacement was viewed as at least moderately important to 84 percent of respondents.
Per usual, fitness equipment and synthetic turf were most often identified as respondents' most successful purchases to date, but software also was cited frequently.
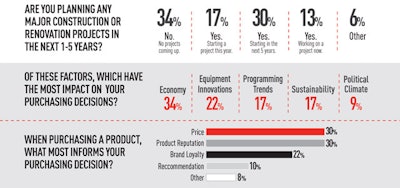
Major construction or renovation projects are in the five-year forecast for 30 percent of this year's respondents. Of those, 57 percent are in athletics, and another 25 percent are in recreation, which led the building boom four years ago. An additional 17 percent of our larger survey pool will launch a project this year, while 13 percent are currently in the middle of a project. Forty-six percent of projects planned or in progress carry a budget of less than $5 million, but 12 percent are projected to cost $20 million or more — a slight increase from 2019 data.
Not surprisingly, our 2020 respondents indicated that they do their homework before buying. In terms of which resources are used in the lead-up to a purchasing decision, each of the following were regarded as somewhat important to very important by at least 58 percent of respondents: word of mouth, websites, tradeshows, print advertisements and editorial articles (with websites and word of mouth leading the way). For the first time in our survey's history, price matched product reputation on our list of factors that most inform a purchasing decision, with each identified by 30 percent of the 2020 sample. Personal experience/brand loyalty was next at 22 percent. In the past, product reputation had consistently ruled, and by as many as 15 percentage points (in 2017).
Other factors impacting purchasing decisions in 2020 include the economy (identified by 92 percent of our sample as having at least some impact), equipment innovations (88 percent), industry-wide programming trends (84 percent) and environmental sustainability (79 percent). A full third of this year's sample identified the economy as an "important factor in decision making" — the highest singular choice presented — an exact repeat of last year's results.
This article originally appeared in the March 2020 issue of Athletic Business with the title "the 2020 Purchasing Survey." Athletic Business is a free magazine for professionals in the athletic, fitness and recreation industry. Click here to subscribe.


